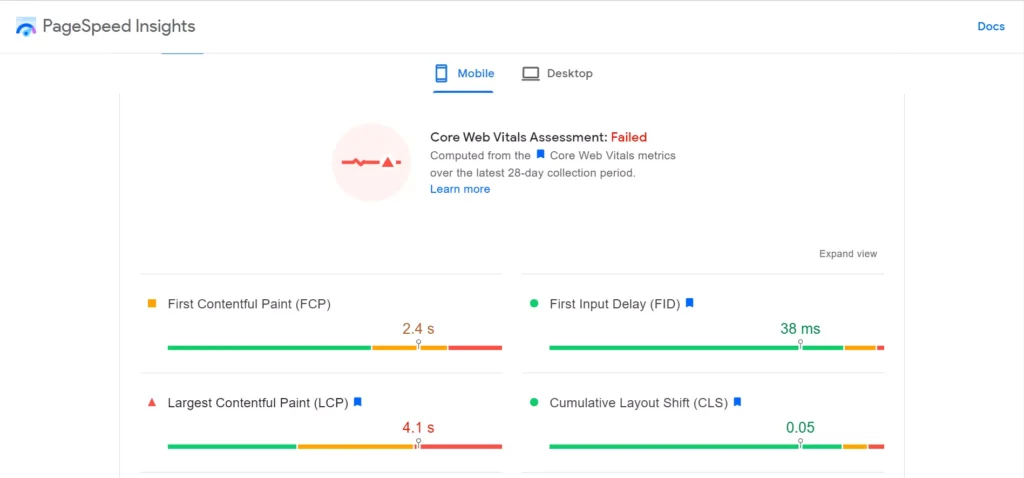
Pingdom was the most popular page speed testing tool, but when Google launched Pagespeed Insights, things changed. Within a few weeks after its launch, PSI became the most popular tool to measure website speed. The older version of PSI showed the PS score of a website/web page on a desktop/mobile device, the reasons for the poor score, and suggestions you can implement on your website or changes you can make to the site or its files to improve the score. In addition to the recommendations and PS score, PSI displays the core web vitals metrics for the page you’re testing with PSI.
Lighthouse was introduced in 2018 by Google. It is a site auditing tool integrated with the latest version of the Chrome browser. You’ll find it in Chromium, Edge too. The tool generates the report PSI generates and a few other reports. Below, we’ve shared the similarities and differences between the two Google tools:
User Interface
Pagespeed Insights is a web-based tool. Once you open it, you have to enter the site’s URL and click the submit button to see your website’s page speed and core web vitals report.
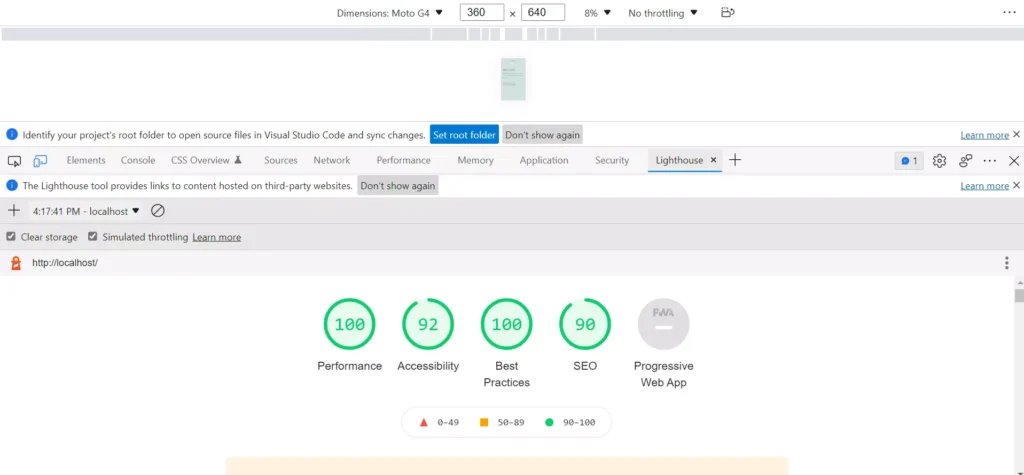
Open the Chrome developer tools and click the Lighthouse tab to run the auditor. Now, you’ll find a list of tests you can run and the virtual device on which you want Lighthouse to run the test. Once you’ve chosen the tests, click the “Generate Report” button.
Lighthouse is available for download as a CLI utility and Node.js module. If you don’t want to use it in the Chrome browser, you can download and use the Lighthouse Node.js module or the CLI utility.
Resources and performance
Pagespeed Insights uses Google server resources to calculate your website’s various page speed metrics. Lighthouse runs the test on your PC/laptop. The test runs for a few seconds only. Once the website audit is complete, the tool will display the report and the following details of the emulator/runtime:
- Device details, network throttling, CPU throttling.
- Channel, host user agent, network user agent, CPU/Memory power.
If you’re using a fast internet connection, Lighthouse will throttle the connection speed automatically, and it will also slow down the CPU, according to Google. When Google PSI runs the test, you won’t experience any slowdown. The browser will slow down when the Auditor runs its tests.
Localhost
This is probably one of the most significant differences between the two tools. Lighthouse lets users test the localhost site’s performance, but you can’t do so with PSI. Thus, you can always fix the performance, SEO, and accessibility issues highlighted by it before deploying the site/app on a server or improving its performance while building it.
Historical data
The report displayed by Google PSI is divided into two parts. Above the fold, it shows the website’s performance in the last 28 days. The tool also shows the average metrics (average LCP, CLS, and FCP score of all websites tested with PSI). Lighthouse displays the current metrics only. The page speed insights report lets you see the page speed metrics on a mobile device and a desktop.
Comparing the data
Unlike PSI which generates a new report each time you run the pagespeed test, Lighthouse enables users to create a new report. If you’ve run the test before clicking the “create new report” button, the auditor will save the older report. You can thus see the difference between the optimized and unoptimized websites within a few seconds. If you’re using PSI, you’ll have to take a screenshot of reports or test the page in two different browser tabs.
Export
Lighthouse enables users to copy the JSON format report data to the system clipboard. You can also save this JSON to the computer or save the entire report to an HTML file or a PDF file using the Print option of the tool. The developers of this website auditing software have built a tool called Lighthouse viewer for viewing the JSON data in graphical form. Users are not allowed to export or save the PSI reports.
Reports
Lighthouse can generate four reports – performance, accessibility, SEO, and best practices. Once it finishes testing the page, the tool displays the score for each test. When you click the score, the tool will open a report that highlights various issues/errors and shows the number of tests the Auditor ran. The following table displays the number of tests the tool runs to generate each report:
| Audit | Number of tests |
|---|---|
| SEO | 12+ |
| Best practices | 16 |
| Accessibility | 10+ |
| Performance | 30+ |
The number of tests Google PSI conducts is the same as the Performance test of Lighthouse.
Closing words: As you can see above, there are many differences between Lighthouse and Pagespeed Insights tools. The former tool generates several useful reports that you can refer to find various issues on your website. PSI is also a useful tool that shows the average FCP, FID, LCP, and CLS score, according to the Chrome UX report.